Forecasting demand accurately depends on having reliable VKMT data that captures real market dynamics. Yet many insights teams struggle with inconsistent datasets that miss critical shifts in vehicle usage patterns across markets, leaving forecasts vulnerable to unexpected disruption.
Market dynamics are shifting rapidly. EV adoption, fleet electrification, and changing mobility patterns are reshaping how vehicles are used.
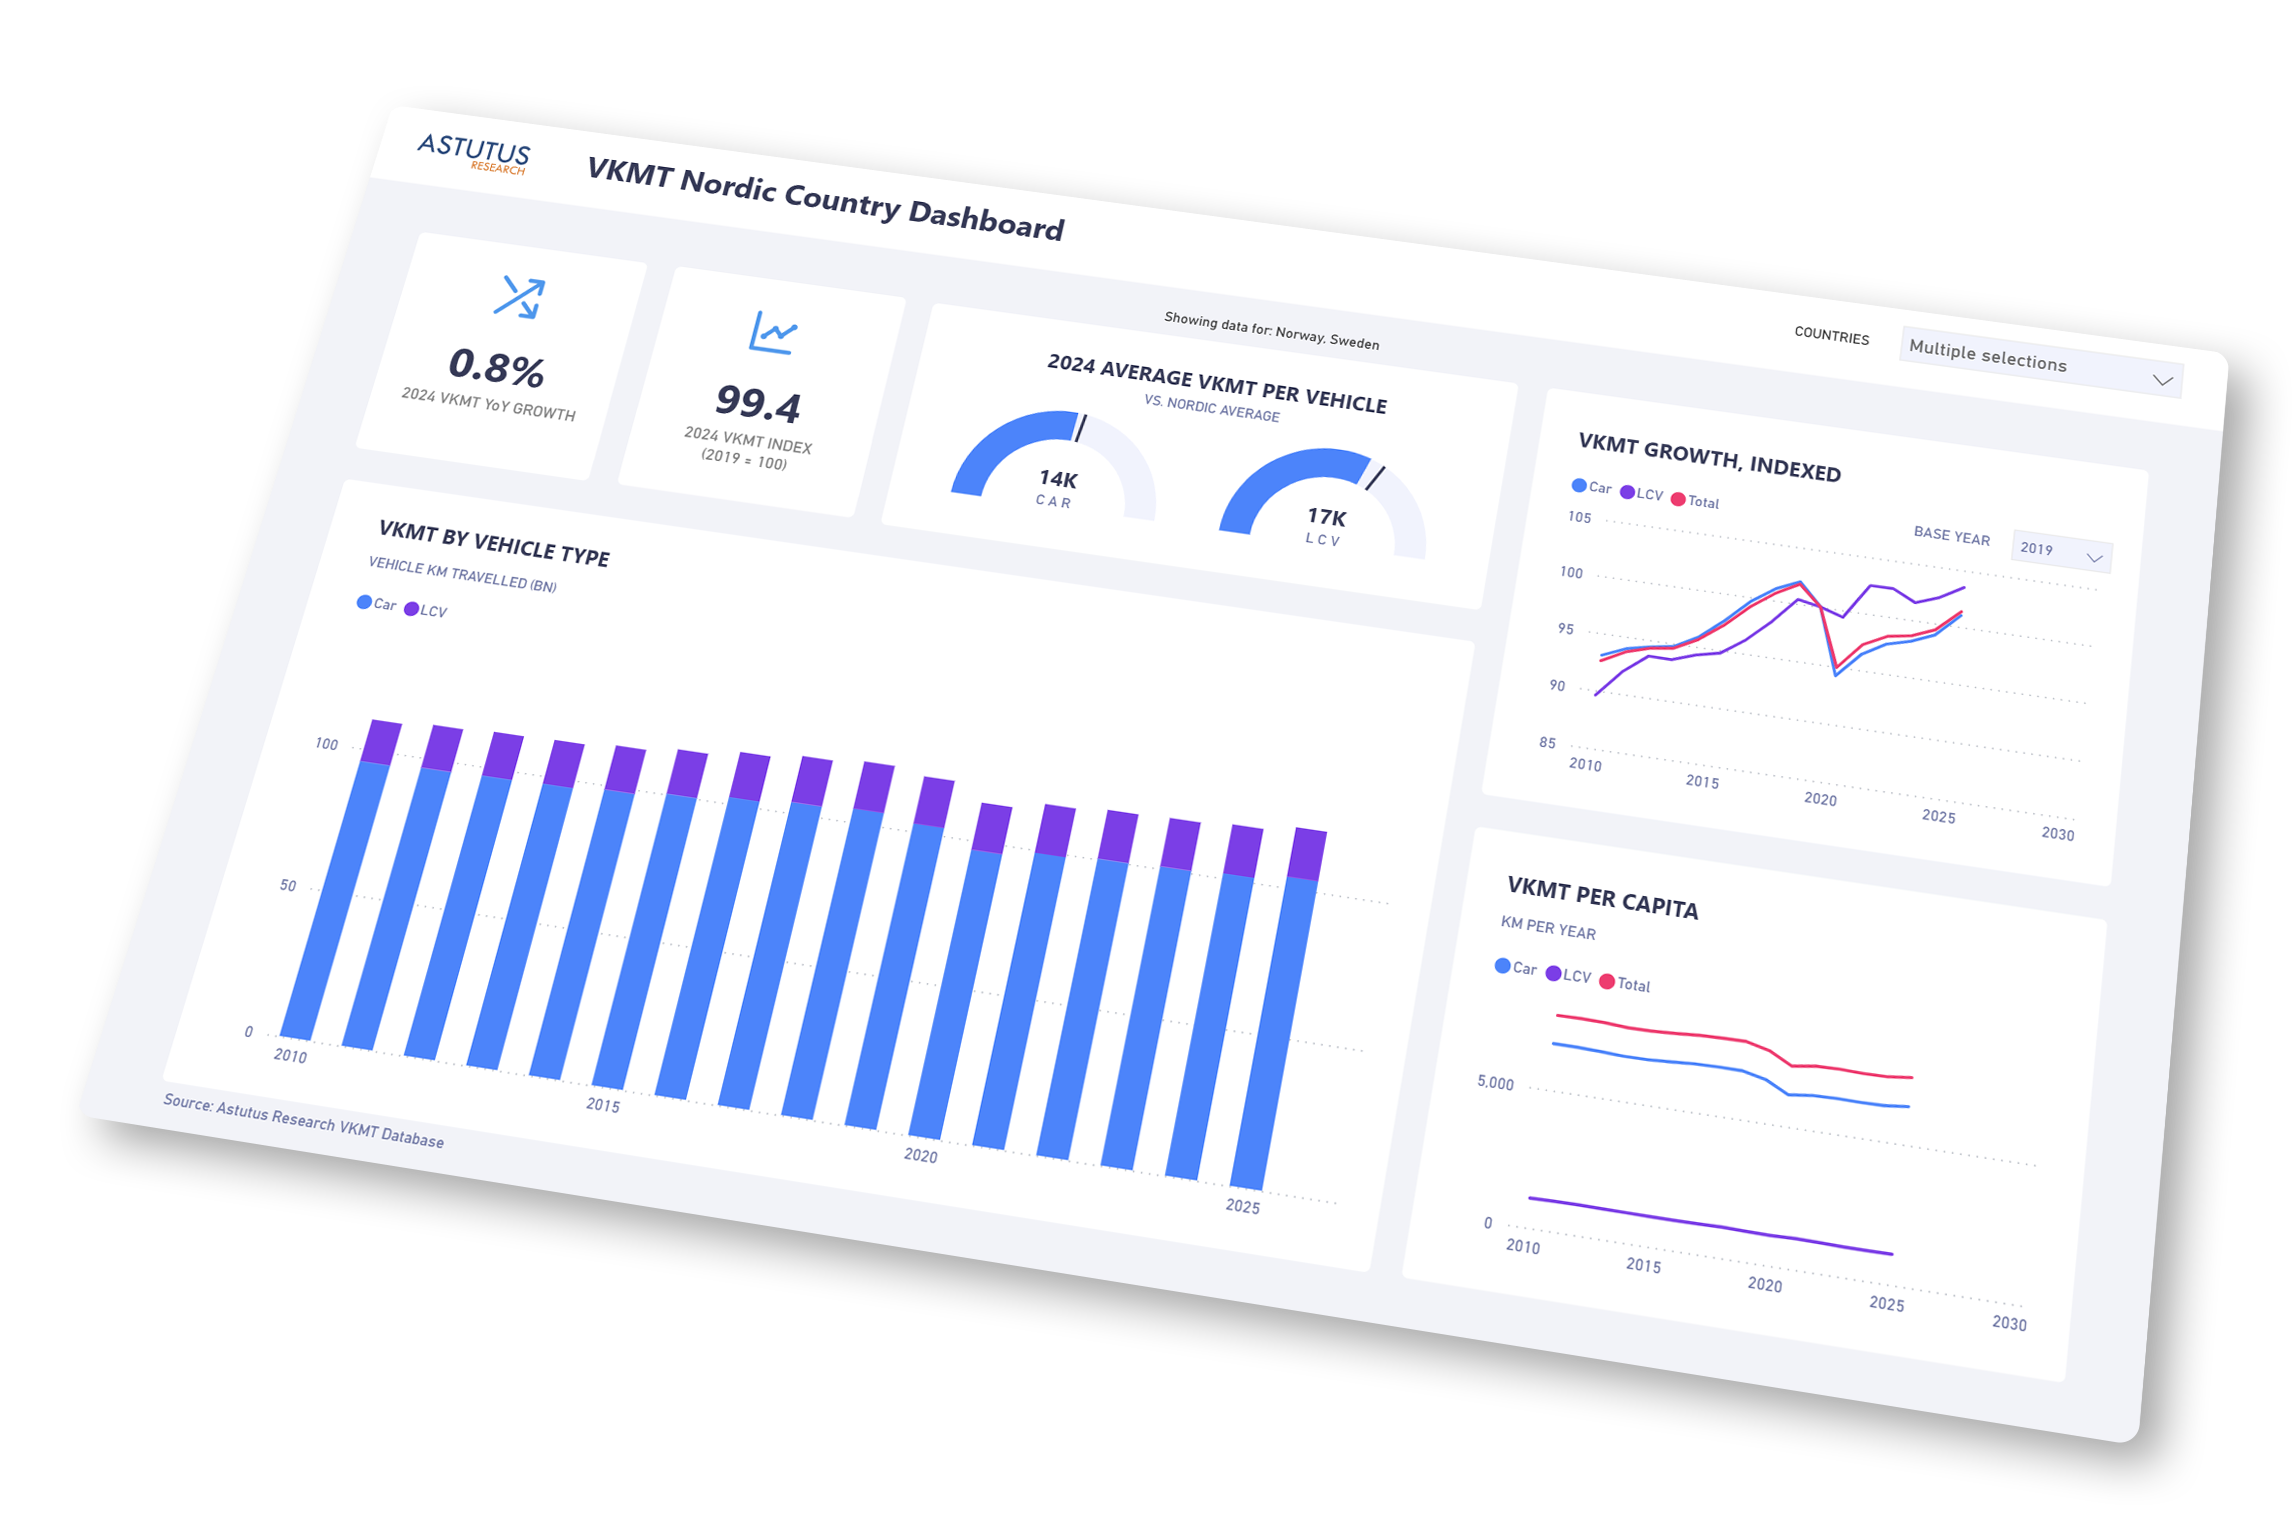
Our free Nordic VKMT Dashboard delivers granular, trustworth data:
Start exploring today. Download now and see why leading manufacturers trust our VKMT data.
Built on the Astutus Research VKMT Database, this dashboard delivers quarterly-updated VKMT data with transparent methodology that builds trust with stakeholders. The data comes structured and ready to integrate into your existing forecasting models—no wrestling with inconsistent formats or unexplained breaks in historical series.
You'll find data from 2010 through to 2025. This continuous time series enables reliable trend analysis without the recalibrations that undermine forecast credibility.
The dashboard segments data by vehicle type (passenger cars and light commercial vehicles) because these categories exhibit different usage patterns and respond differently to market forces. Whether you're focused on replacement tire demand or fleet dynamics, the segmentation supports your specific analytical requirements.
Key metrics include year-on-year growth rates, indexed values benchmarked against 2019, average VKMT per vehicle, and per capita figures that reveal market maturity. These indicators immediately communicate whether markets are expanding, contracting, or stabilising.
Nordic markets share characteristics yet behave distinctly. Norway leads global EV adoption; Denmark and Sweden show different urbanisation patterns; Finland presents unique geographic challenges. The dashboard enables side-by-side comparison, revealing which markets demonstrate resilience and where disruption is most pronounced.
Per capita analysis normalises for population differences, helping you distinguish between growth driven by fleet expansion versus increased utilisation - a critical distinction when forecasting segment-specific demand.
Built in Microsoft Power BI, the dashboard offers dynamic exploration. Filter by year ranges, focus on specific countries, toggle between vehicle categories, and examine the data points most relevant to your analysis. The interface ensures powerful analytics remain accessible whether you're a data specialist or business strategist.
You'll rapidly understand where each Nordic market sits in its lifecycle and how usage patterns are evolving. Is VKMT growth sustaining, plateauing, or declining as alternative mobility gains traction? These insights strengthen your ability to forecast with confidence rather than hope.
The Nordic region leads Europe in electrification. Through VKMT trends, you'll observe how this transition correlates with usage pattern changes - critical intelligence for anticipating demand shifts in both premium and volume segments.
By exploring data from the same source that leading manufacturers use, you'll understand what "good" looks like in VKMT intelligence - the granularity, transparency, and update frequency that makes forecasts defensible when challenged.
Integrating reliable VKMT data reduces forecast errors and increases confidence in your demand models. When leadership questions your numbers, you'll reference the same trusted data source that industry leaders rely on.
Nordic markets reveal emerging patterns early—EV-driven growth in premium segments, modal shift in urban areas, fleet electrification dynamics. Spotting these trends positions you as the analyst who sees shifts coming rather than explaining them afterwards.
Using transparent, quarterly-updated data from a recognised source eliminates internal debates about data validity. Your forecasts become the "source of truth" that strategy and planning teams trust.
Whether evaluating Nordic market entry, sizing capacity requirements, or allocating resources across segments, empirical VKMT data grounds your recommendations in market reality rather than assumptions.
This complimentary Nordic dashboard demonstrates the data quality and analytical capability available in our comprehensive VKMT Europe Power BI solution, covering 26 European markets with even greater depth. We're providing free access so you can evaluate whether our data strengthens your forecasts and builds your credibility before committing to the full solution.
Unlock your free Nordic VKMT Dashboard now. Experience forecast-ready data that helps you see market shifts coming, and builds confidence in every number you present.